直方图均衡与空间滤波
直方图均衡(理论题)
Suppose that you have performed histogram equalization on a digital image. Will a second pass of histogram equalization (on the histogram-equalized image) produce exactly the same result as the first pass? Prove your answer.
进行第二次直方图均衡的结果与第一次相同。证明过程如下:
以连续灰度值为例。用变量 表示初始图像的灰度,并假设 的取值范围是 。用变量 表示第一次直方图均衡的输出灰度值,用变量 表示第二次直方图均衡的输出灰度值,并令 、 和 分别表示随机变量 、 和 的概率密度函数.
由变换函数可得:
于是有:
进行第二次直方图均衡后,
对应的概率密度函数为:
由此可见,进行第二次直方图均衡的结果与第一次相同。
直方图均衡(编程题)
Write a function that applies histogram equalization on a gray image. The function prototype is “equalize_hist(input_img) → output_img”, returning a gray image whose histogram is approx- imately flat. You can modify the prototype if necessary.
For the report, please load your input image and use your program to:
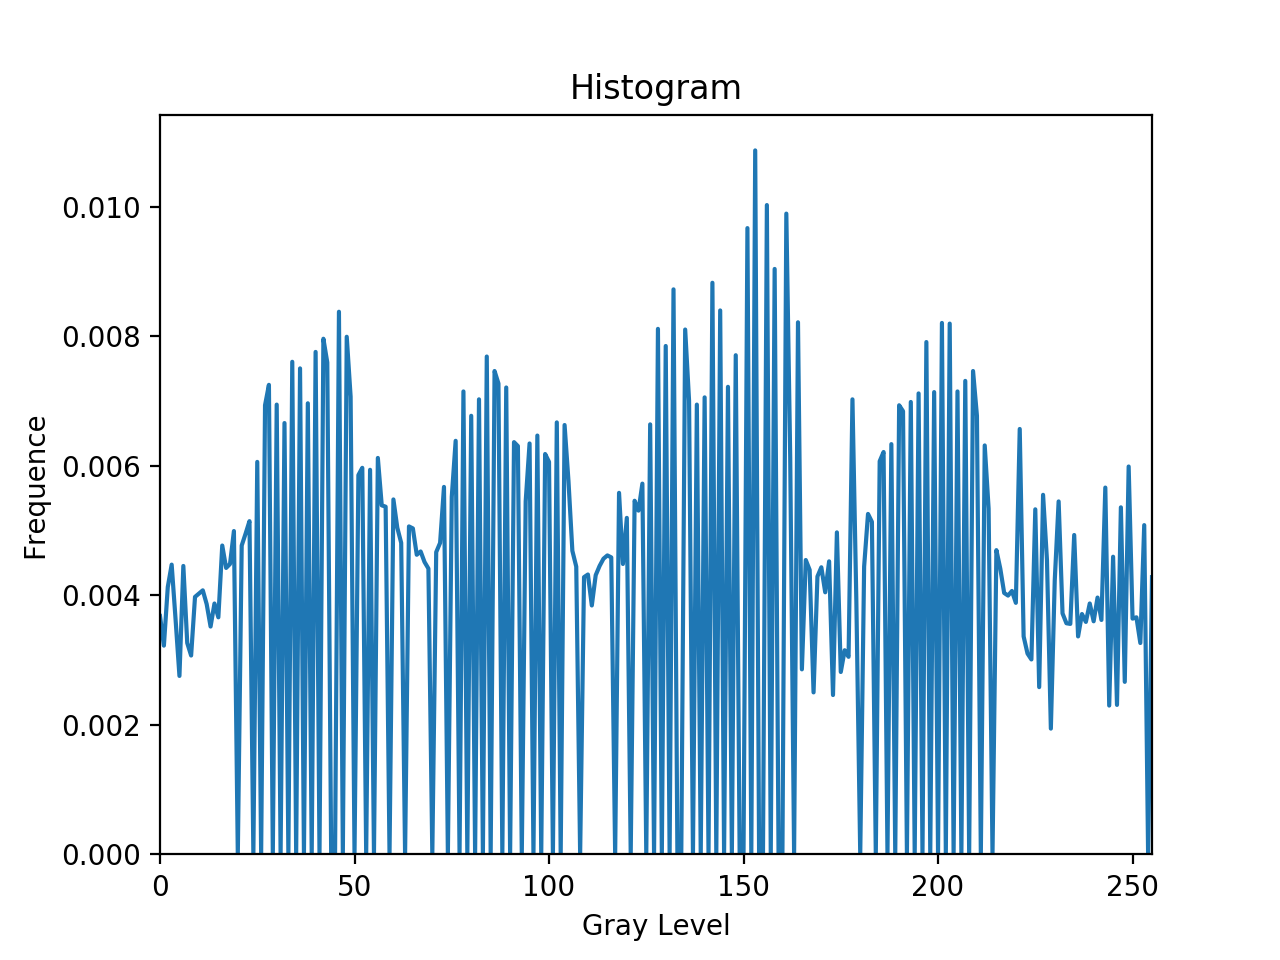
1. Compute and display its histogram. Manually paste the histogram on your report. Note: You must compute the histogram by yourself, but third-party APIs can be used for display.
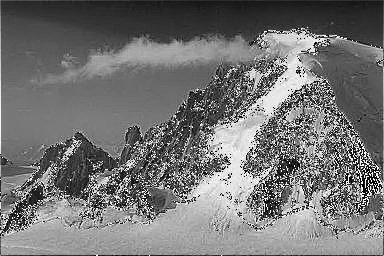
原图:

制作直方图的脚本:
from PIL import Image
import matplotlib.pyplot as plt
import numpy as np
import sys

def main():
    # image
    filename = sys.argv[1]
    im_matrix = np.array(Image.open(filename).convert('L'))
    # create a histogram of the image
    hist = np.zeros(256)
    count = 0
    for row in im_matrix:
        for gray_data in row:
            hist[gray_data] += 1
            count += 1
    hist = hist / count
    # create the plot
    plt.title("Histogram")
    plt.plot(hist)
    plt.axis([0, 255, 0, np.max(hist) * 1.05])
    plt.xlabel("Gray Level")
    plt.ylabel("Frequence")
    plt.show()

if __name__ == "__main__":
    main()
直方图:

2. Equalize the histogram, and paste the histogram-equalized image and the corresponding histogram on your report.
进行一次直方图均衡后的图像:

该图像对应的直方图:

3. Equalize the histogram again, and paste the resulting histogram on your report. Does this second pass of histogram equalization produce exactly the same result as the first pass? Why?
进行第二次直方图均衡后的图像:

该图像对应的直方图:

结果与第一次直方图均衡的相同,原因见第一题。
4. Please discuss how you implement the histogram equalization operation in details, i.e., the “equalize_hist” function.
算法的流程如下:
-
求出每一个灰度级别所出现的频率。
-
求出每一个灰度级别所对应的累积分布。
-
将每个灰度级别所对应的累积分布乘上 255,用于灰度的变换。
-
对于每个像素的灰度,求出该灰度级别在上一步中求得的结果,作为变换后的输出值。
代码:
from PIL import Image
import numpy as np
import os
import sys

def equalize_hist(input_img):
    # image array
    im_matrix = np.array(input_img)
    # create a histogram of the image
    hist = np.zeros(256)
    count = 0
    for row in im_matrix:
        for gray_data in row:
            hist[gray_data] += 1
            count += 1
    hist = hist / count
    # accumulative frequency
    acc_freq = np.zeros(256)
    acc_freq[0] = hist[0]
    for i in range(1, 256):
        acc_freq[i] = acc_freq[i - 1] + hist[i]
    # transformation array
    trans = (acc_freq * 255).astype(int)
    # histogram equalization
    for i, row in enumerate(im_matrix):
        for j, gray_data in enumerate(row):
            im_matrix[i][j] = trans[gray_data]
    return Image.fromarray(im_matrix).convert("L")

def main():
    # image
    input_file = sys.argv[1]
    input_img = Image.open(input_file).convert('L')
    # histogram equalization
    output_img = equalize_hist(input_img)
    # save output image
    f, e = os.path.splitext(input_file)
    output_file = f + "_eh" + e
    output_img.save(output_file)

if __name__ == "__main__":
    main()
空间滤波(编程题)
Write a function that performs spatial filtering on a gray image. The function prototype is “filter2d(input_img, filter) → output_img”, where “filter” is the given filter. You can modify the prototype if necessary.
1. Smooth your input image with 3 × 3, 5 × 5 and 7 × 7 averaging filters respectively. Paste your three results on the report.
3 × 3 均值滤波器:

5 × 5 均值滤波器:

7 × 7 均值滤波器:

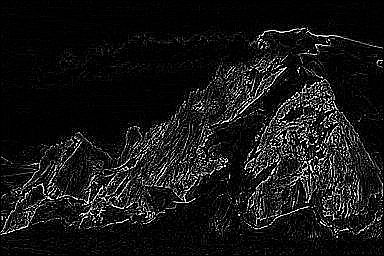
2. Sharpen your input image with a 3 × 3 Laplacian filter and then paste the result. In addition, briefly discuss why Laplacian filter can be used for sharpening.
拉普拉斯滤波器:

拉普拉斯算子是一种微分算子,能够反映图像中灰度的突变。因此,图像微分增强边缘和其他突变,而削弱灰度变化缓慢的区域。
3. Perform high-boost filtering on your input image. Choose a k as you see fit. Write down the selected k and paste your result on the report.
选用 3 × 3 均值滤波器,并设置 k = 3,结果如下:

4. Detailedly discuss how you implement the spatial filtering operation.
-
Step 1: 根据滤波器的大小填充相应的数值为 0 的行与列。
-
Step 2: 将滤波器旋转 180°,然后用滑动窗口的方法进行乘法求和,得出全部卷积结果。
-
Step 3: 对卷积的结果进行裁剪,恢复为原来的图形大小。
代码:
from PIL import Image
import numpy as np
import os
import sys

def filter2d(input_img, filter):
    # image array
    im_matrix = np.array(input_img)
    row, col = im_matrix.shape
    # zero padding
    filter_size = filter.shape[0]
    padding_size = filter_size // 2
    padding_im_matrix = zero_padding(im_matrix, padding_size)
    # convolution
    reverse_filter = np.flip(filter)
    convol_matrix = np.zeros((row + 2 * padding_size, col + 2 * padding_size))
    for i in range(padding_size, padding_size + row):
        for j in range(padding_size, padding_size + col):
            submatrix = padding_im_matrix[i - padding_size : i + padding_size + 1,
                                          j - padding_size : j + padding_size + 1]
            convol_matrix[i][j] = round((submatrix * reverse_filter).sum())
    # output
    output_im_matrix = convol_matrix[padding_size : padding_size + row,
                                     padding_size : padding_size + col]
    return Image.fromarray(output_im_matrix).convert("L")

def zero_padding(matrix, padding_size):
    row, col = matrix.shape
    new_matrix = np.zeros((row + 2 * padding_size, col + 2 * padding_size))
    new_matrix[padding_size : padding_size + row, padding_size : padding_size + col] = matrix
    return new_matrix

def high_boost_filtering(input_img, filter, k):
    im_matrix = np.array(input_img)
    blurred_im_matrix = np.array(filter2d(input_img, filter))
    mask_matrix = im_matrix - blurred_im_matrix
    return Image.fromarray(im_matrix + k * mask_matrix).convert("L")

def main():
    # image
    input_file = sys.argv[1]
    input_img = Image.open(input_file).convert('L')
    # filters
    # filter_3_3 = np.ones((3, 3)) / 9
    # filter_5_5 = np.ones((5, 5)) / 25
    # filter_7_7 = np.ones((7, 7)) / 49
    filter_laplacian = np.array([[1, 1, 1],
                                 [1, -8, 1],
                                 [1, 1, 1]])
    # spatial-filtering
    output_img = filter2d(input_img, filter_laplacian)
    # save output image
    f, e = os.path.splitext(input_file)
    output_file = f + "_sf" + e
    output_img.save(output_file)

if __name__ == "__main__":
    main()
